How does it work?
Overview of the game

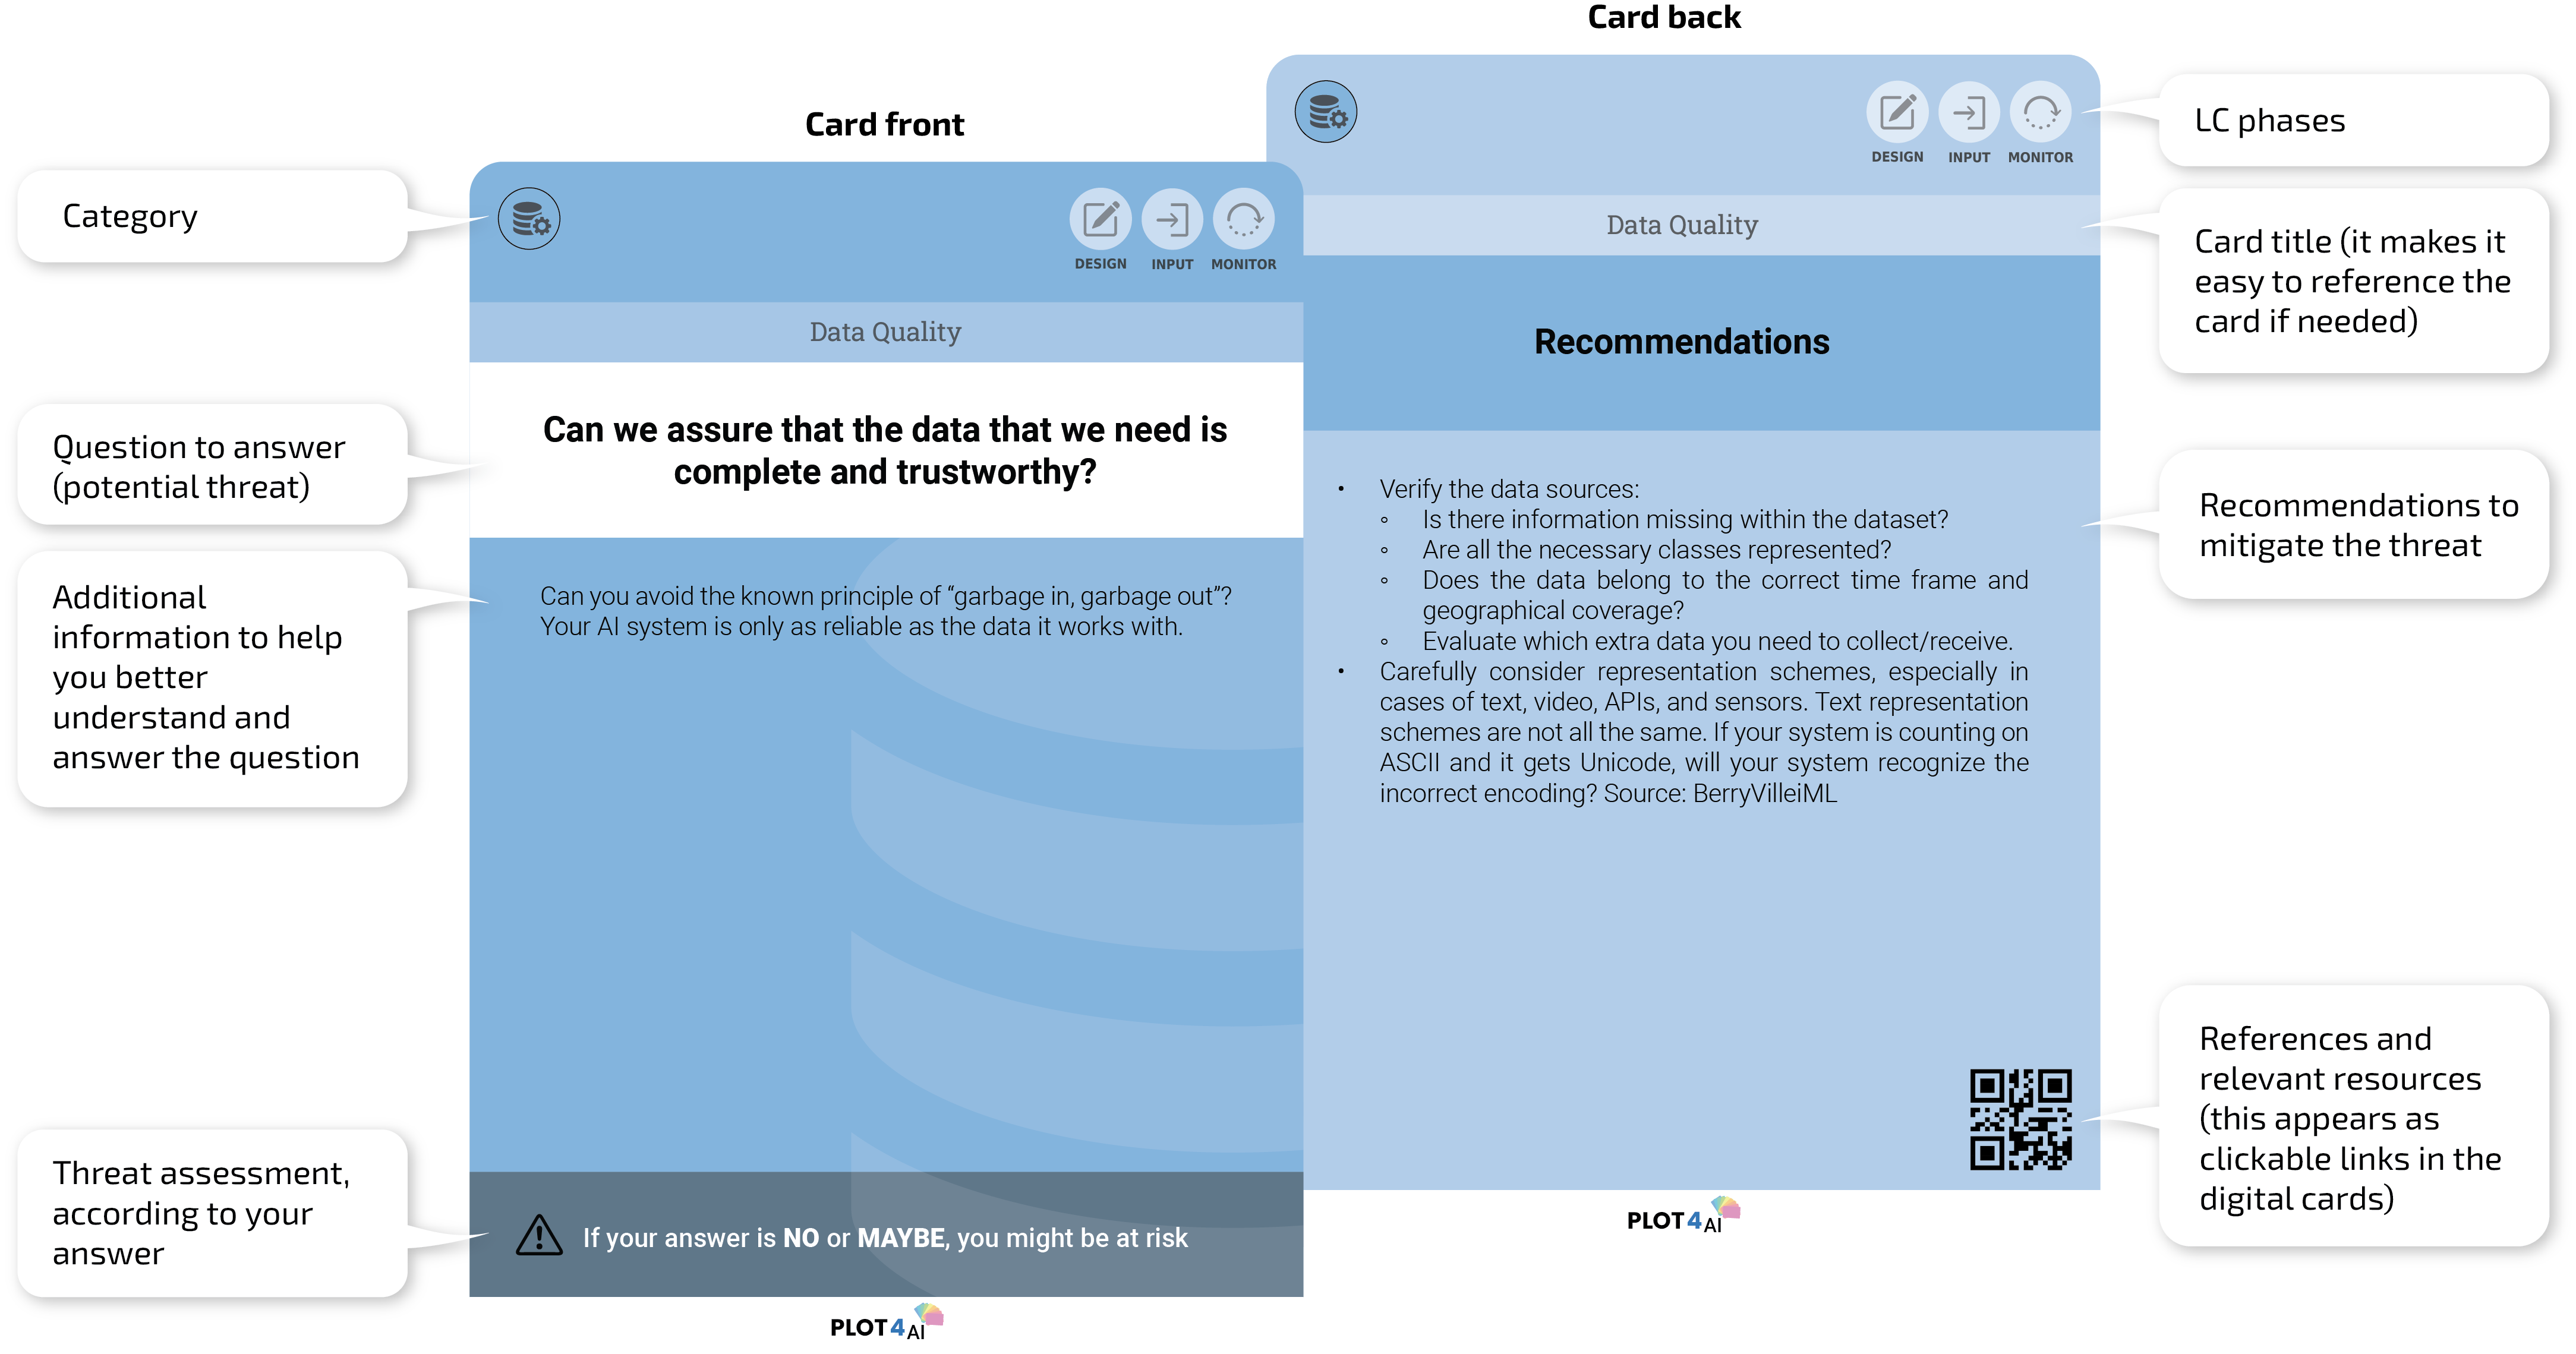
PLOT4AI contains 138 cards, each representing a threat related to AI. The cards display icons indicating when the threat can occur in the AI Life Cycle:
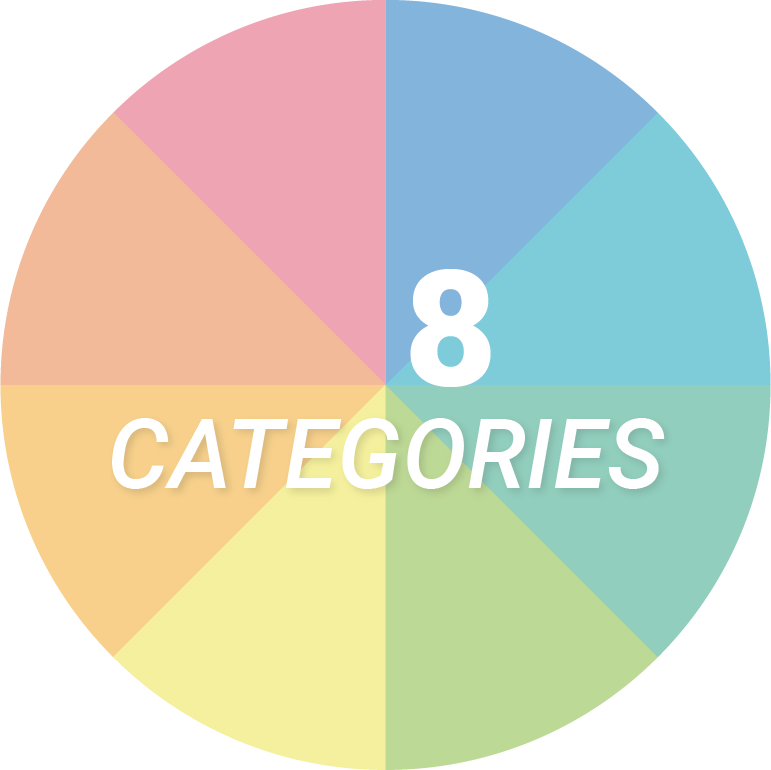
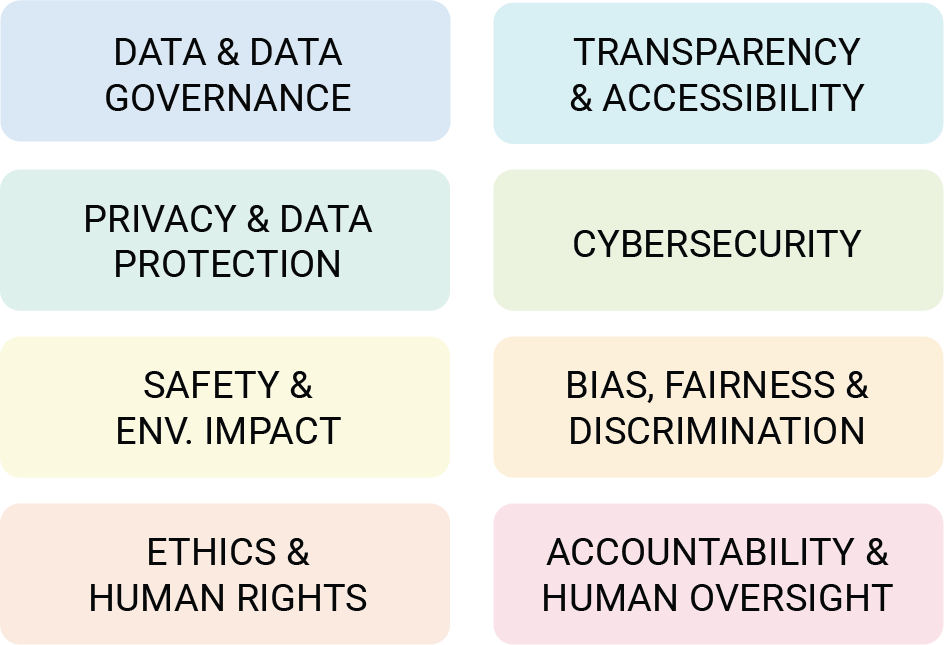
The cards are grouped into 8 categories of risk. Each card is labeled with at least one category, with some cards belonging to more than one.
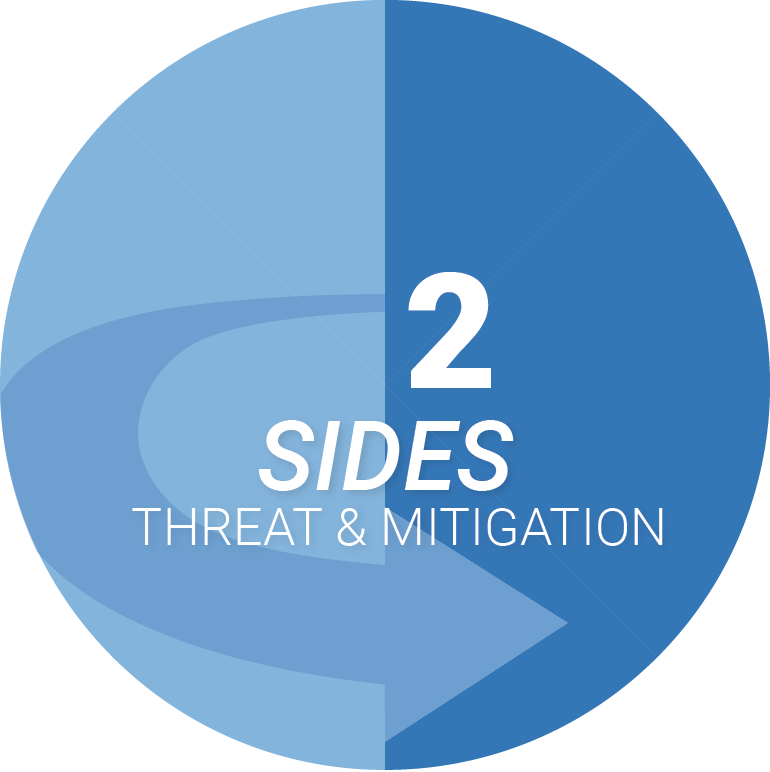
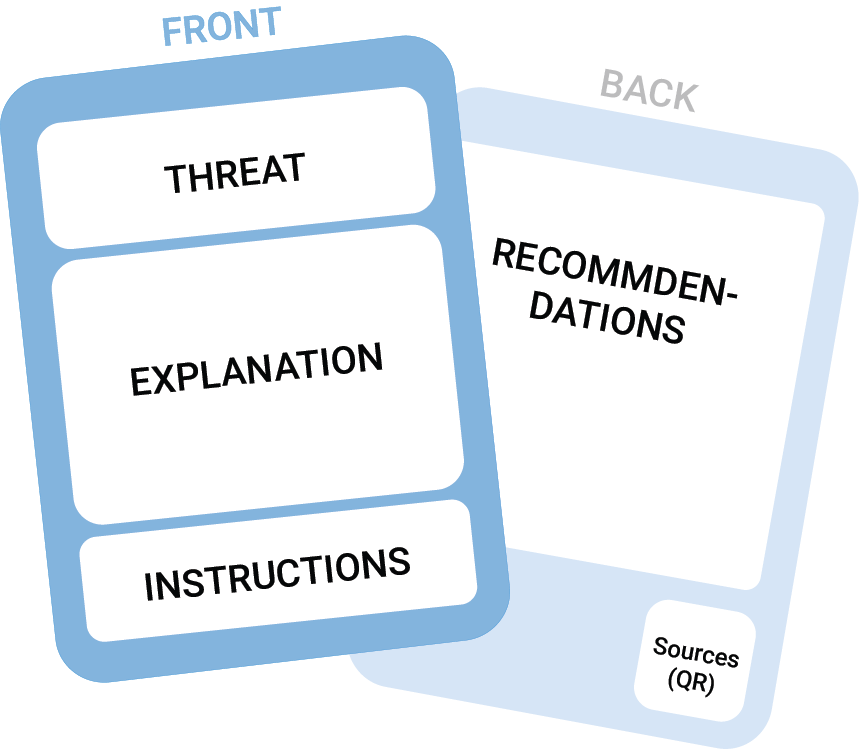
Each card has two sides. The front presents and briefly explains the threat, while the back offers recommendations and tips for mitigation.

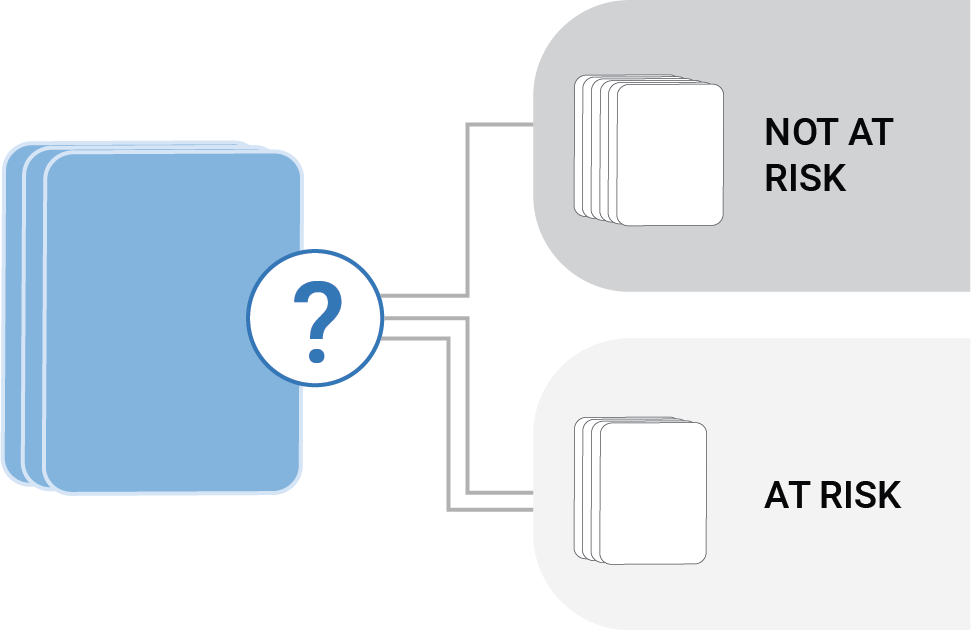
Threats are introduced in the form of elicitation questions. Based on your answer (yes, no or maybe), the card will indicate whether a threat is applicable or not.
Do you want to know more about how to use PLOT4AI?
Watch this 5-minute video or scroll down for more deatils
The categories
The 8 categories in which the threats are classified, reflect PLOT4AI's holistic approach towards AI risk management. They help you consider the technical, legal, social and ethical risks of AI, in alignment with the latest AI regulations and standards.
| Category | What is it about | |||
|---|---|---|---|---|
| Data & Data Governance |
| Inadequate management and quality of the data used in your AI system, leading to inaccurate and harmful outputs. | ||
| Transparency & Accessibility |
| The AI decisions or interactions are not understandable or accessible to all users, which limits the usability of your AI system and reduces trust. | ||
| Privacy & Data Protection |
| Lack of proper personal data protection measures, increasing the risk of unauthorized access, misuse, or legal violations. | ||
| Cybersecurity |
| Insufficient security measures that can lead to data breaches, adversarial attacks, or system manipulation. | ||
| Safety & Environmental Impact |
| Hazards and sources of risks that might cause harm to employees, users, infrastructure, or the environment. | ||
| Bias, Fairness & Discrimination |
| Presence of bias in the data or design of the AI system, leading to unfair treatment of individuals or groups. | ||
| Ethics & Human Right |
| Overlooking the ethical and societal impact of the AI system, which could result in interference with one or more human rights or lead to unintended harm. | ||
| Accountability amp; Human Oversight |
| Unclear responsibility for decisions of the AI system and lack of mechanisms for human oversight, increasing the risk of unintended consequences. | ||
AI System Life Cycle
PLOT4AI contains 6 System Life Cycle phases
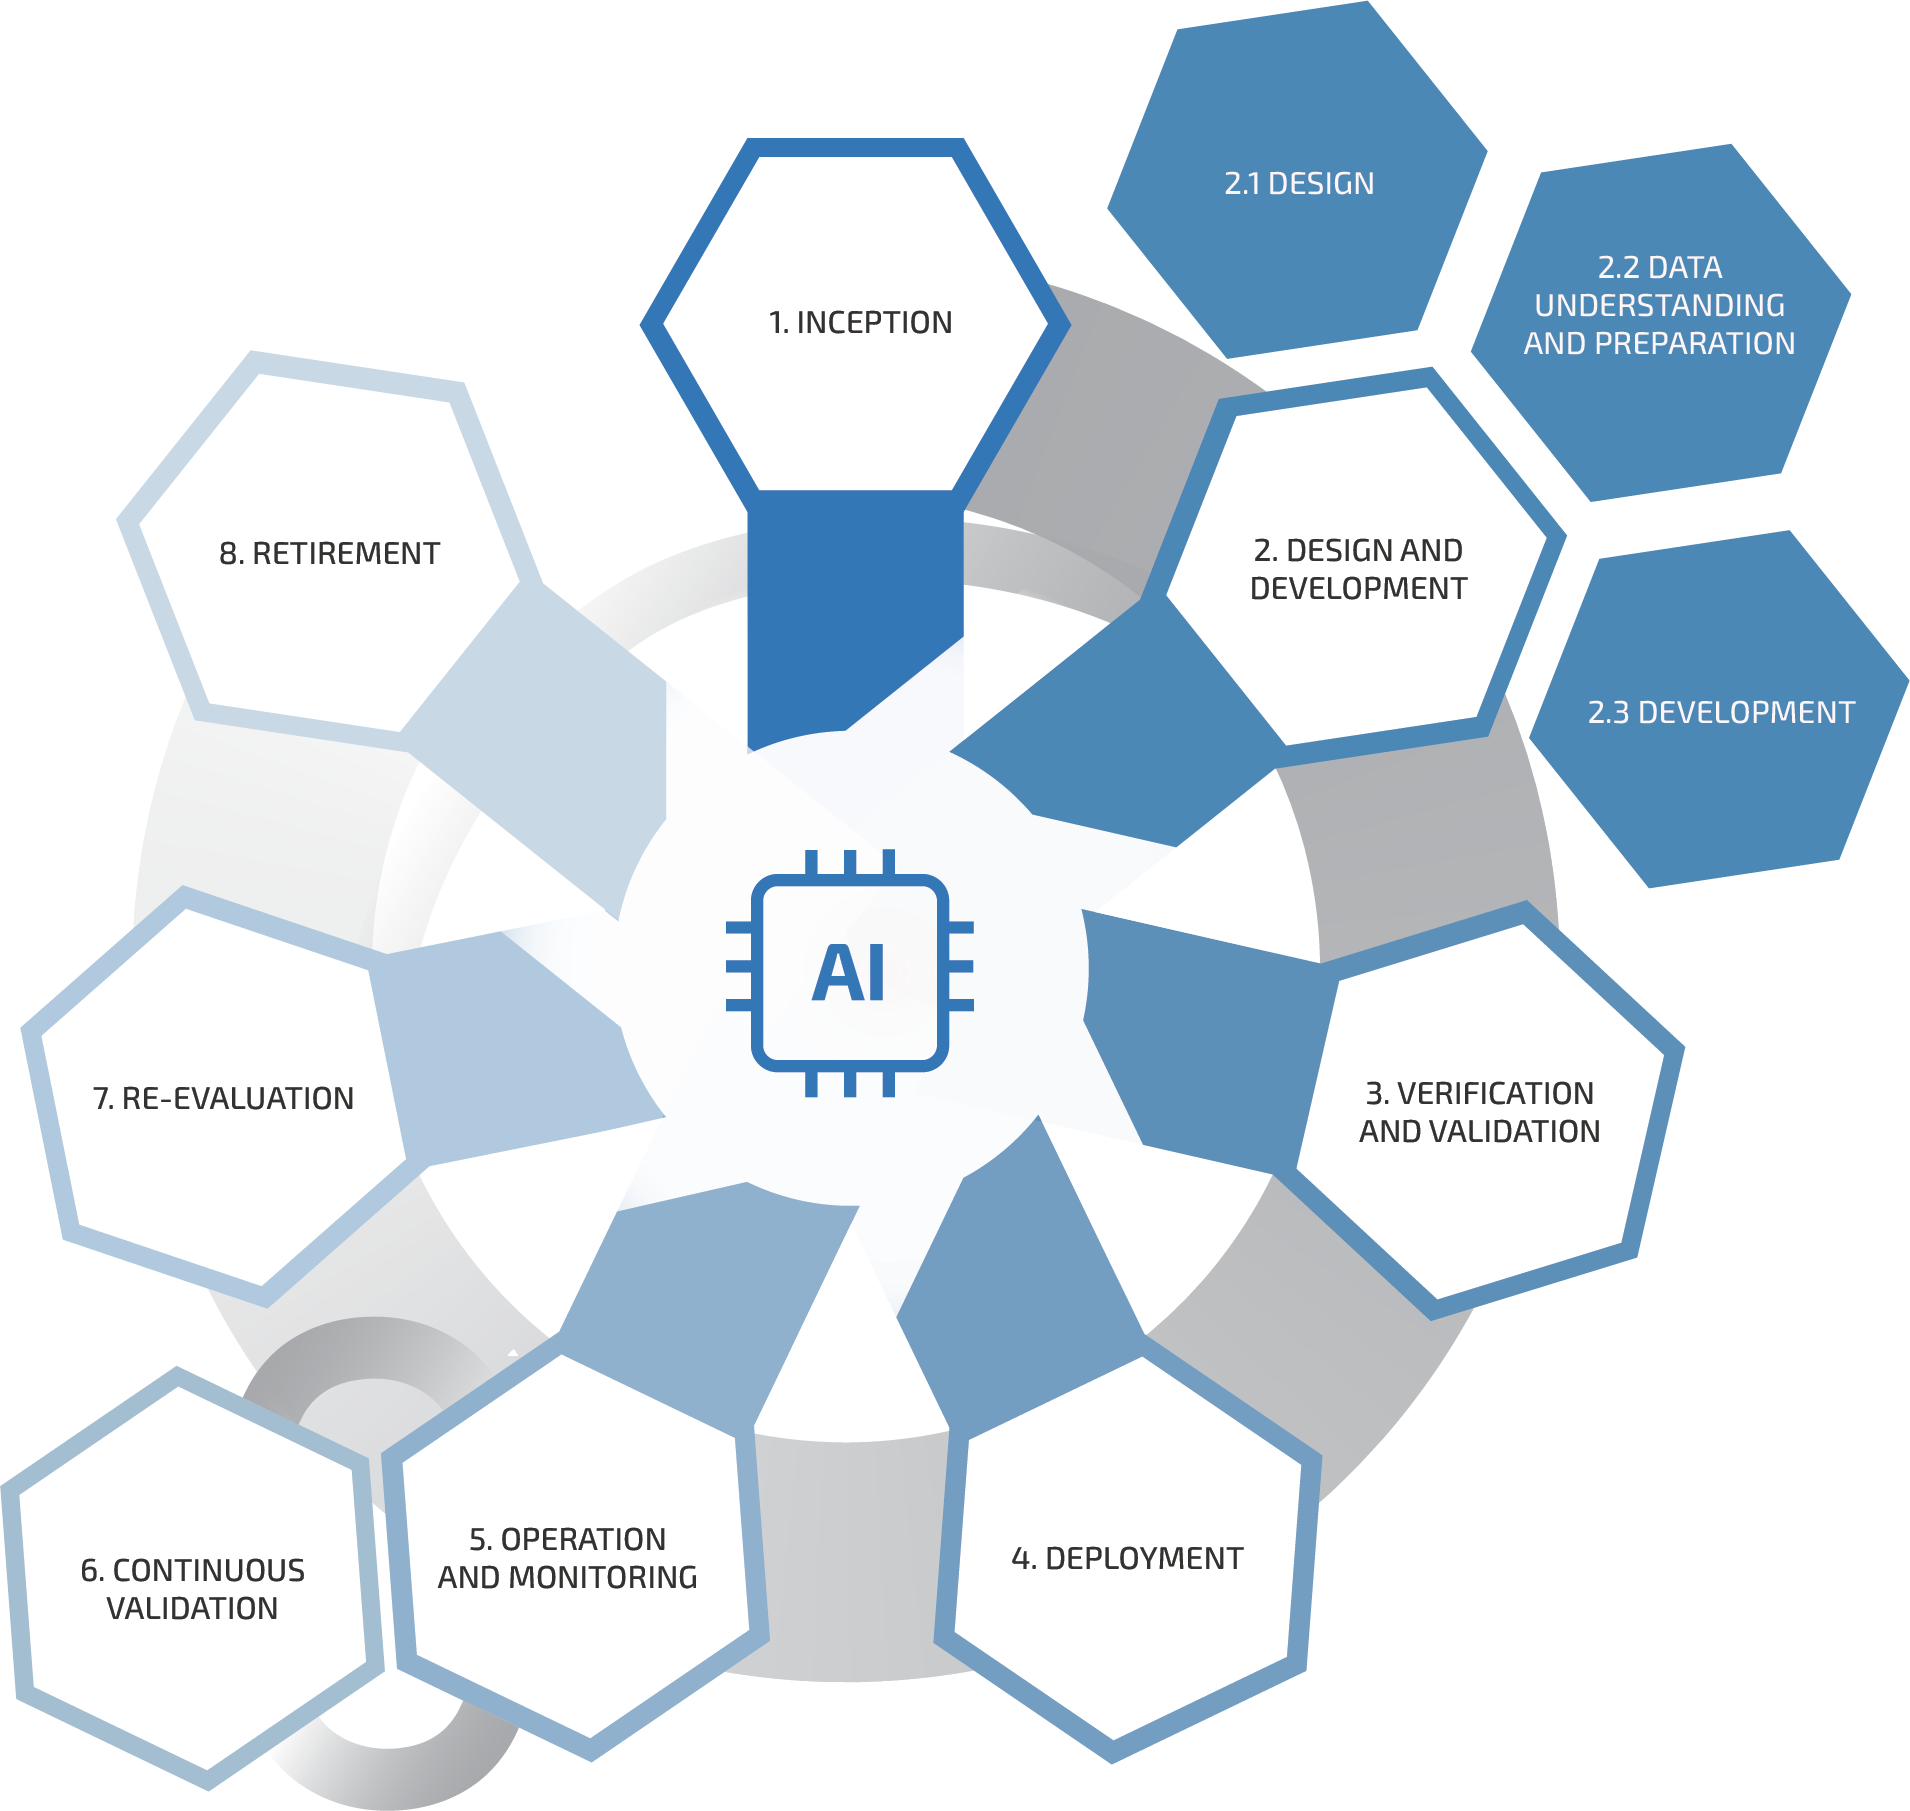
Organizations adopt different AI lifecycles tailored to their specific needs. In PLOT4AI, we have chosen a six-phase lifecycle that is adaptable, practical, and usable across all organizations. While a full AI system lifecycle may include additional phases, such as the retirement phase in ISO/IEC 22989, we focus on the phases where most threats identified in PLOT4AI arise. However, if a threat could also emerge in a non-mentioned phase, this is explicitly noted on the threat card, ensuring users remain aware of risks beyond the selected phases. This ensures a practical and effective approach to AI risk identification and mitigation.
Complete life cycle of an AI system (from ISO/IEC 22989)
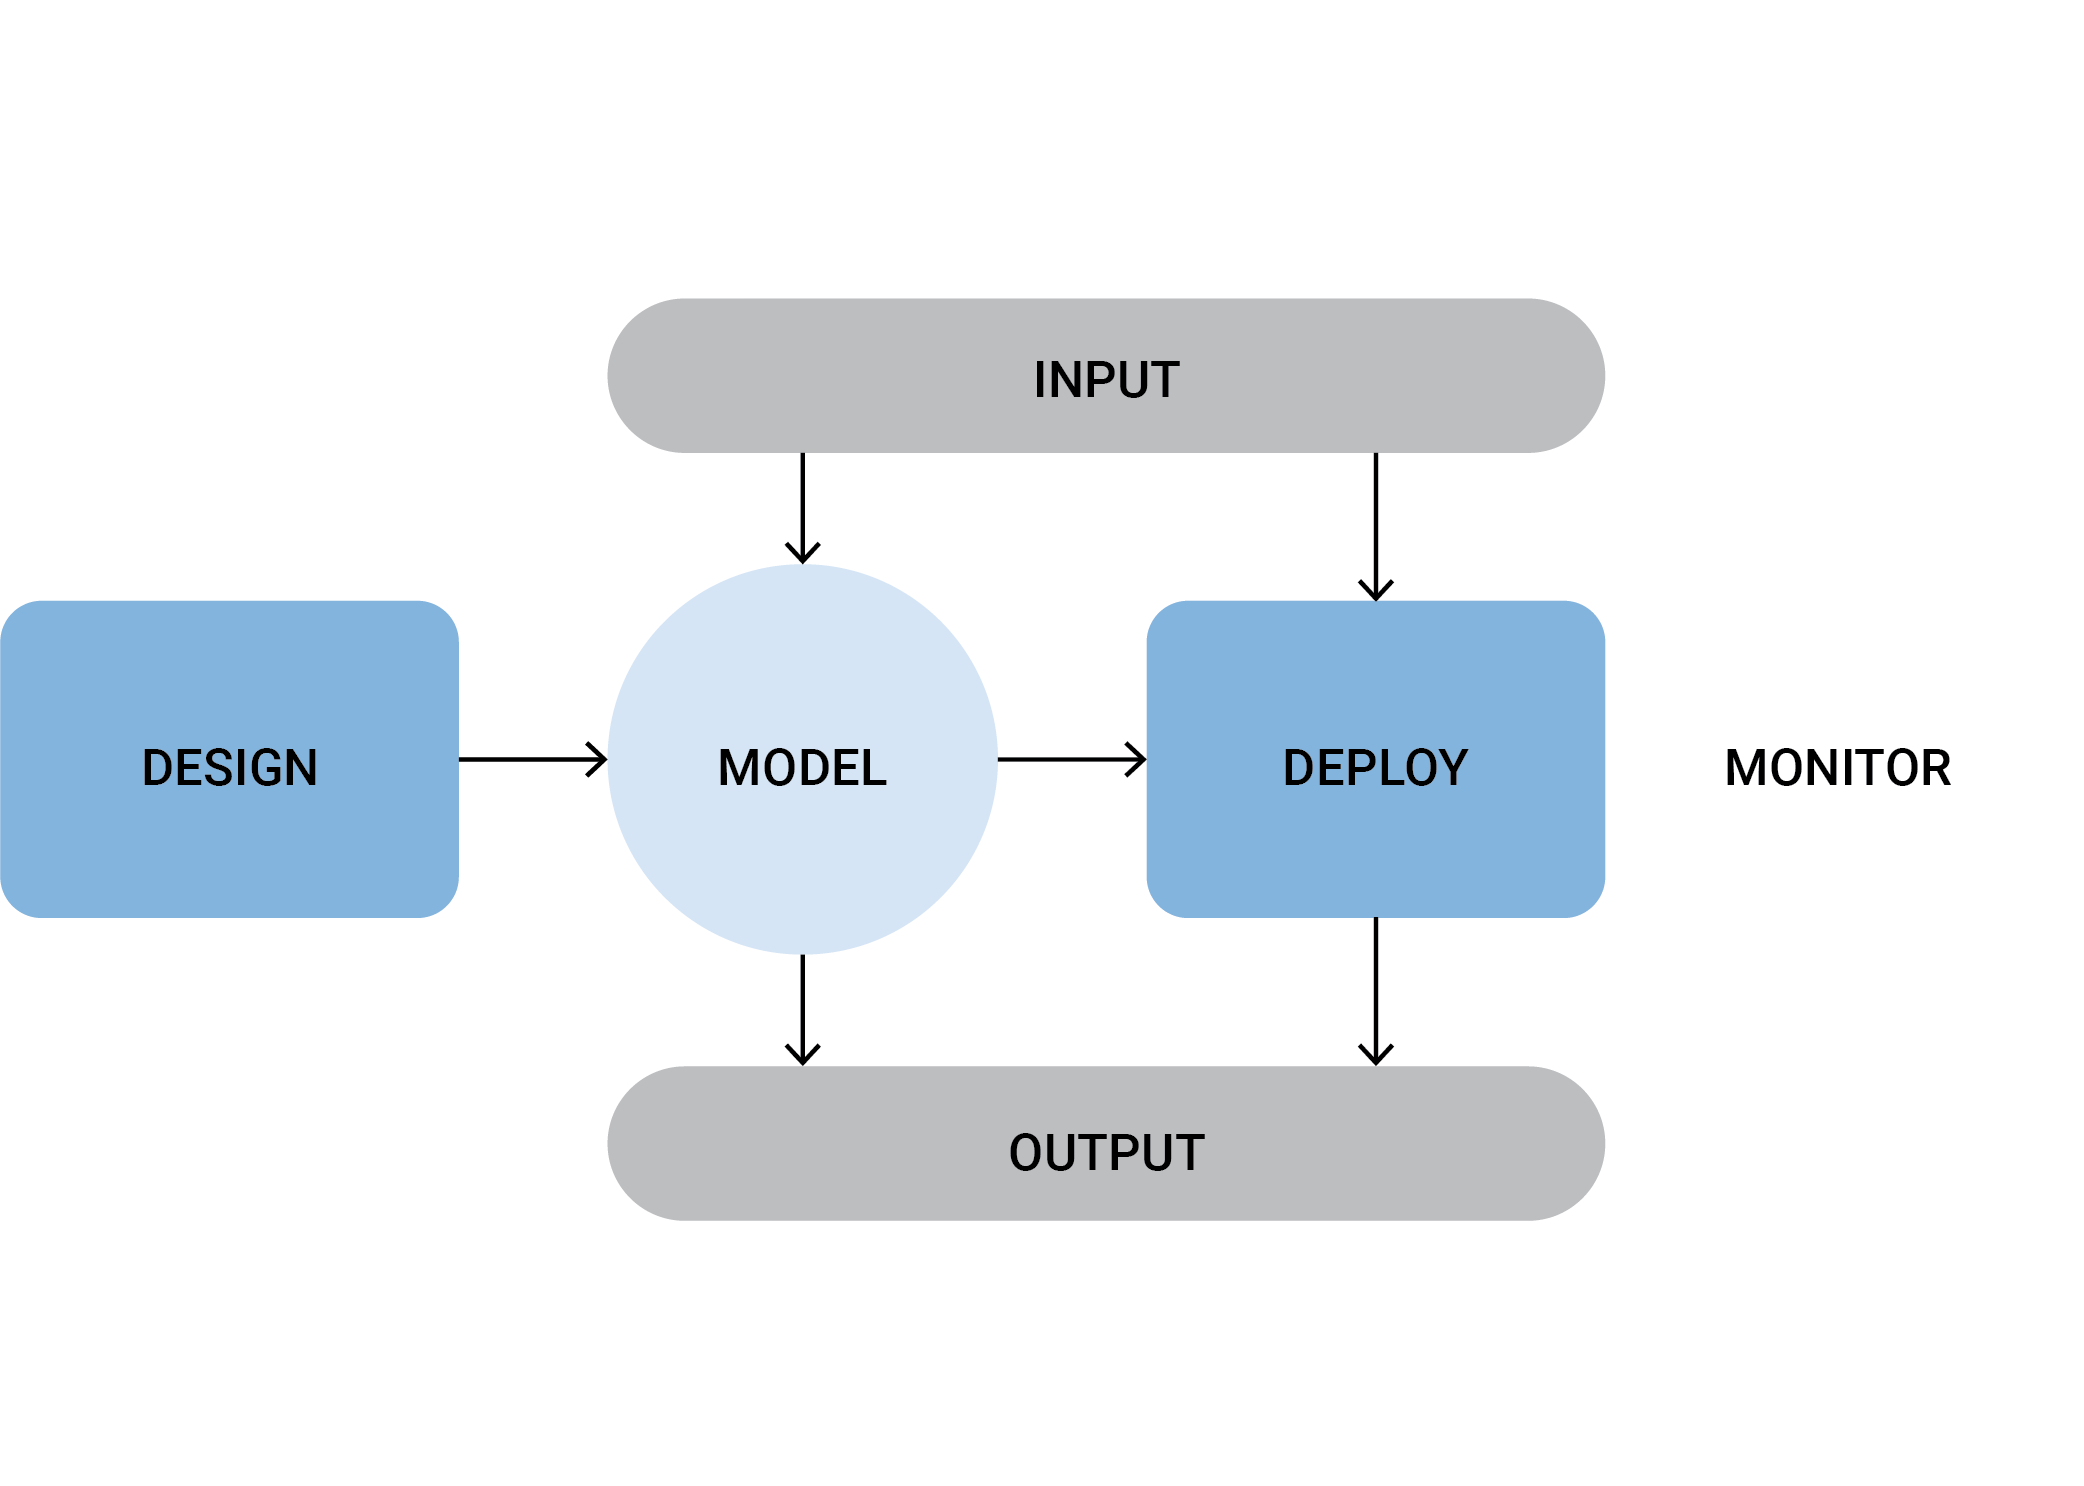
Life Cycle phases in PLOT4AI
Data Flow Diagram
In threat modeling it is common practice to use a Data Flow Diagram (DFD) as a visual representation of the system you are going to analyze. A DFD offers you a good overview of the possible flows of data and architecture, thereby making it easier to spot threats. When threat modeling an AI system you could start with a basic way of representing the data flow and architecture. But you can also use a more complex representation, showing for instance the end points and interactions with other systems when you are collecting, receiving or sharing data, when you are storing your training data and/or models in the cloud, when you are using ML libraries, when and where APIs are used, etc...
PLOT4AI in Threat Dragon
An open source tool that can facilitate the process of creating a DFD is the OWASP Threat Dragon.
https://owasp.org/www-project-threat-dragon/
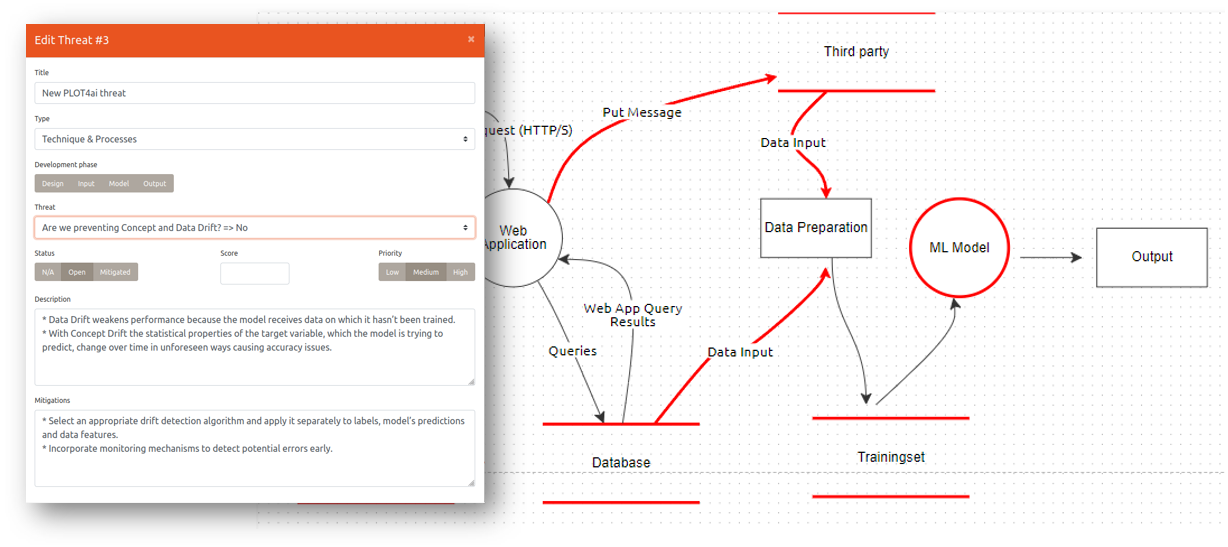
Example of a DFD from Threat Dragon using PLOT4AI integration:
Threats as Cards
The cards are color-coded based on their category, but all follow the same structure. Each card presents a threat through an elicitation question. This approach helps focus attention and encourages engagement, especially during the design phase, when many decisions need to be made.
Why do some cards have more than one category icon?
All threats fall under a main category; this is represented by the color of the card and the first icon on the left. But some threats could also fall under other categories; these categories appear as extra icons besides the main category icon.
Why do some cards have more than one LC icon?
Most of the threats can be applied to more than one phase of the Life Cycle. Although it is recommended to go through all the threats during the design phase, this might not be necessary if your organization already has a strong quality management process implemented and a certain organizational maturity level. You can also find cards with all 6 icons of the LC on the right side. The reason for this is that some threats can have an impact throughout the whole life cycle, and new events during the first phases could trigger changes that create new threats or open ones that were thought to be mitigated.
Using PLOT4AI in practice
Quick tips before starting
![]() Sessions should not be longer than 1.5, max. 2 hours to avoid tiredness and lack of focus.
You can also do 30-minute timeboxed sessions focused on just one or two specific categories.
Sessions should not be longer than 1.5, max. 2 hours to avoid tiredness and lack of focus.
You can also do 30-minute timeboxed sessions focused on just one or two specific categories.
![]() Preparing for the session by selecting the right questions is very important.
For example, if you are already past the design phase, exclude threats that have already been addressed in quality assurance to avoid double work.
Preparing for the session by selecting the right questions is very important.
For example, if you are already past the design phase, exclude threats that have already been addressed in quality assurance to avoid double work.
![]() It is important to identify all the relevant stakeholders that need to be present in the session.
Especially in the design phase, involve a wide range of different decision-makers and experts. A diverse group improves discussions!
It is important to identify all the relevant stakeholders that need to be present in the session.
Especially in the design phase, involve a wide range of different decision-makers and experts. A diverse group improves discussions!
![]() If you want to focus on the prioritization of threats, consider adding an extra column for “Effort” in the Threat Report Template (see step 4 below).
If you want to focus on the prioritization of threats, consider adding an extra column for “Effort” in the Threat Report Template (see step 4 below).
![]() You’ll need a facilitator to guide the session. This doesn’t have to be an expert, but having some familiarity with the topic helps.
Decide upfront who will take on this role.
You’ll need a facilitator to guide the session. This doesn’t have to be an expert, but having some familiarity with the topic helps.
Decide upfront who will take on this role.
![]() Establish clear rules for timeboxing: how long a discussions can last per threat, and when exceptions are allowed. This will keep the session focused and productive.
Establish clear rules for timeboxing: how long a discussions can last per threat, and when exceptions are allowed. This will keep the session focused and productive.
Step by step instructions:
Actions:
- Gather stakeholders
- Select the cards you are going to use
- Prepare a Data Flow Diagram (optional)
Gather a group of stakeholders and create a DFD of the system and interaction elements you want to analyze. However, you can even start the threat modeling session without a DFD, as it may not always be essential depending on the use case. Select cards for the session, either randomly or by focusing on a specific category (check also the Quick tips). Whether or not you have a DFD, make sure all relevant stakeholders are present—now, you can start the threat modeling session.
Actions:
- Read the card front out loud
- Discuss the possible threat together
Discuss the possible threat together, timeboxing how long to spend on each answer. Two minutes per answer is usually enough, but allow exceptions if the group needs more time to reach a consensus. For more nuanced categories, such as Ethics & Human Rights, consider giving more time per question, as it typically requires deeper reflection from the group.
Actions:
- Reach consensus on the answer to the question
- Check on the card whether you found a threat according to your answer
- Turn the card to read the recommendations (optional)
The card will indicate whether answering YES or NO to the main question identifies a threat. If you're unsure, there's always a possibility you've found one. If you find a threat, turn the card to read the recommendations—this is optional, and you can also choose to do this after the session, during your risk management process.
Actions:
- Document all the identified threats using the Threat Report Template
- Classify each threat as a Low, Medium or High risk
- Add other relevant notes to the report, such as threat ownership
After reviewing all the cards, analyze each identified threat. Ideally, conduct a thorough risk analysis by assessing the probability and severity of each threat. However, you can start by documenting your PLOT4AI session results using our Threat Report Template. This template helps you classify threats as Low, Medium, or High, making it easier to prioritize actions. You can also use it to note possible actions and assign a (risk) owner.
Next steps:
- Threats can also be added to your project backlog (in Jira for instance). If you work Agile, you can do refinements to go through all the user stories in the backlog.
- You can decide to focus on easy/quick fixes first and later follow up on the rest. For example, you might find threats that can be considered like a warning, but that are not really risks yet that you can mitigate at that moment. However, don’t forget these threats and review them regularly.
- You can train your team in knowledge areas related to each category of PLOT4AI such as AI security, data protection, and ethics. This can also be beneficial to facilitate the threat modeling sessions.
- PLOT4AI can support your risk identification phase within your risk management process:
Benefits
Makes risk identification fun (and easy)
Using PLOT4AI reduces rework and saves time: it helps you clarify the purpose of your AI system and it provides an effective framework to manage expectations around critical risks.
Helps you with regulatory compliance
PLOT4AI can help you comply with AI regulations and the results can be used to complement a Security, Fundamental Rights, or Data Privacy Impact Assessments.
Drives process improvements
On top of managing AI risks, addressing threats can lead to meaningful improvements within your processes. Registering threats and maintaining an overview of mitigations supports better decision-making and KPI reporting.
Promotes stakeholder collaboration
The threat modeling sessions bring all stakeholders on the same page, reducing time spent in endless discussions. They also bring structure to teams, and increase knowledge sharing and collaboration.